
The researchers found out that our brain can process any image 60,000 times faster than any other representation of data. Moreover, our visual information accounts for 90 percent of all information transmitted to the brain. If god has gifted us this power of visualization, why can’t we utilize it to perform workflow visualization to build an effective workflow automated environment?
Visual Workflow can make our work easier, improve data processing, and transform business standards into an automated business work culture.
Still, the question is, why is it necessary to visualize processes? The necessity comes when organizations deal with highly complex data every day, which is time-consuming and erroneous if documented manually.
As these data can be represented in visual ways, this can develop more precise decision-making, as a result, better production. The productivity eventually depends on the business process automation that relies strongly on visualizing your workflow.
As we are now aware of the fact that we are visual creatures, so we should not waste our time executing better solutions to leverage workflow visualization which can develop new ideas to fulfill our business goals.
What is Workflow Visualization?
Workflow visualization is a versatile methodology that refers to visual evidence to give a top-level view of the sequence of the process and helps in upgrading project management. It gives you a concise blueprint of the project goals at once, thereby automating each development step of the project in the flow. To create a workflow diagram for your process, you can make use of the tools available.
Visualization tools possess functional graphics that the employees can easily use with their featuring workflow elements. Employees while building their business process automation steps can use its drag-and-drop workflow elements at ease. Hence, workflow visualization tools are visually oriented workflow management systems that simplify our visual planning and give a thorough multiple series reports for an overall work process. Then, it becomes easier for the users to figure out the challenges and, as a result, can change them prior to execution.
A workflow builder is a workflow visualization tool that minimizes steps and builds an efficient strategy for dealing with work through automation. It possesses a visual interface that works with a user-friendly approach without any technological barriers. Let us look through it in brief.
Also Read: Effective ROI results with No-Code Business Workflow Automation
What is Workflow Builder?
Workflow builder enables companies to customize their workflow and make it more efficient using tools that help streamline projects, organize work, and build a level of connectivity among employees. Overall, it builds a collaborative work schedule by automating workflows as well as the routine process of the team. The survey of Delloite reports that 36% of companies are now relying on business process management tools to make their workflows automated.
This tool customizes your workflows by following some steps, adaptations, and actions. Ultimately, it minimizes employees’ load and enhances the company’s outcomes in lesser time. It also provides you with a duality of building either simple or complex workflows, depending on your work process.
Also Read: How Visual Programming Transforms Software Development?
Benefits of Workflow Visualization
Workflow visualization enhances the productivity of the organization by enabling you to figure out the visual representation of the overall project at once. We generally use this tool to bring improvement in our work process without relying on technological knowledge. Some influential insights that will give you a to understand why visualization makes us productive. List below are the top benefits of visualizing workflow:
1. Higher Transparency
Workflow visualization offers transparency for the team, stakeholders, as well as managers. Workflow visualization makes it easy to look at the progression of your work process. It also enables you to see the bottlenecks at any step of the work process so that you can take rescue decisions on time. This also results in saving resources like time and effort.
Also Read: Visual Workflow Builder: Simplifying Process Automation
2. Enhanced Collaboration
Workflow visualization processes ensure team collaboration. Despite just listing tasks, you can also mention the requirements of each task separately. It acts as an add-on feature for your team, that helps in better communication and collaboration.
With this, team members can include due dates, share attached files, and update task assignees. Various tools of workflow diagram online possess some alterations in their features however the motive remains the same.

3. Define Priorities
Workflow visualization also helps employees in prioritizing and re-prioritizing the tasks, by simplifying the process. This makes it less ambiguous and enables employees to figure out the most important tasks. It makes it easier to take decisions when you possess minimal resources while automating your business processes.
It is simple to understand what each team member is working on. Others may use this information to assess their capacity for additional labor and its implications for the project.
Also Read: Workflow Redesign Before Digitization: Why Smart Companies Fix How Work Flows First
4. Improvements
Visualizing workflows offers you an opportunity to figure out where you are going wrong to improve it earlier. Every high-performing team takes stock of how they operate—their procedures, frameworks, and technological frameworks. Teams find it easier to identify improvement opportunities as the process of assessing progress and success is made simpler by workflow visualization tools.

How to Create a Workflow Diagram in 4 Steps?
A four-stage approach is advised to guarantee the persuasive powers of visualization. The workflow visualization consists of these four stages:
1. Recognize workflow diagram shapes and symbols
Visualizing workflows requires a general understanding of the elements of the process, which include shapes and symbols. Let us figure out what these shapes and symbols represent while structuring a workflow diagram.
- Oval: It represents the starting and ending points of any task.
- Diamond: Generally used for decision-making. One path reflects True, whereas a separate one reflects False.
- Rectangle: It tells you about some action or instruction.
- Arrow: It represents the flow of the process from one place to another.
- Circle: Reveals a connection among flow elements.
- Clock: It represents a time delay.
2. Determine the process that requires visualization
With the small organization, you can move on with the top-down approach to determine the key areas that require observation. Then draw the final workflow as per your decision.
However, for the big organizations, it may not be possible to determine the entire end-to end-process at once.
3. Split tasks into smaller ones
Firstly, locate the functional areas. Separate the task or procedure into its parts and arrange them according to the workflow process diagram’s three major segments:
Input: It includes the tools, capital, information, resources, labor, or other things required to start and finish the transition.
Process: It involves the actions and modifications made to the process to produce the output using the input.
Output: It represents the end results.
4. Choose the best workflow visualization tool
The most important step is to finalize a perfect workflow diagram tool that will eventually determine your successful production. An excellent visualization tool is simple to use, has an intuitive user interface, and supports drag and drop. The users must prefer cloud-based technologies that enable the entire team to collaborate and share information in real-time.
Examples of Data Visualization Workflow
Let us take an example of how visualizing the workflow with a diagram can help in understanding the complete process of automating the content marketing workflow.
- The visualization of for content marketing initiates when the user shares the blog idea.
- The best aspect of the visualization is that you may personalize the guidelines you want your authors to adhere to.
- Once an idea is submitted, a reviewer might comment on it, accept it, or reject it.
- With the acceptance of the content idea, an SEO specialist can add comments on the blog title, and the keywords you want to target.
- Following the SEO strategy, the creator then creates his content and submits it.
- Once submitted, the blog is reviewed for publication.
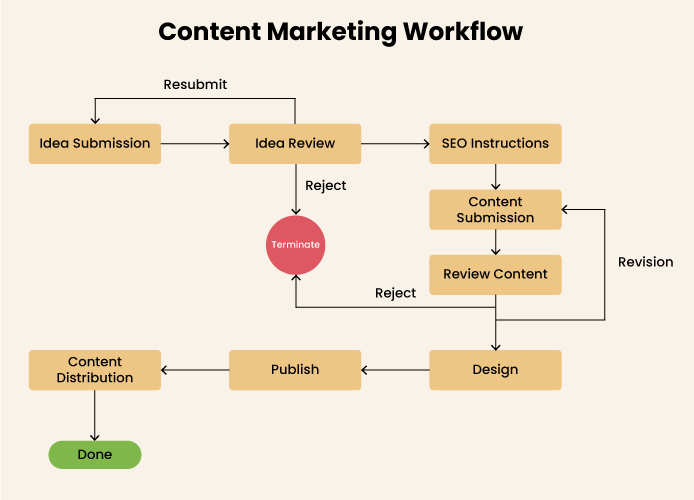
This visualization of workflow distributes every individual with their specific roles like a content strategist, SEO analyst, Content writer, and community evangelist.
Visually representing your workflow from generating a content idea to its distribution can build a strong picture in the mind of the content creator. This can help the creator to perform the overall workflow at ease with better productivity than by assuming things and producing results.
Also Read: Automating your Content Marketing Workflow is a walk in the park with Quixy
How Quixy Will Help You in Workflow Visualization
Quixy makes workflow visualization simple, powerful, and accessible for every business user—no coding required. With its intuitive drag-and-drop interface, you can design workflows that clearly map every step of your process and automate them instantly.
Here’s how Quixy helps you transform workflow visualization into real business value:
- Drag-and-Drop Workflow Builder: Design complex workflows in minutes using visual elements like decisions, actions, and connectors—no technical skills needed.
- Real-Time Collaboration: Enable teams to co-create, share, and refine workflows on a single platform, ensuring alignment across departments.
- AI-Powered Suggestions: With features like AI Caddie, Quixy helps you optimize workflows, detect bottlenecks, and get smarter recommendations for efficiency.
- Customizable Dashboards & Reports: Gain a visual overview of processes, track progress, and monitor KPIs for better decision-making.
- Seamless Automation: Move beyond visualization—Quixy allows you to automate approvals, notifications, and repetitive tasks directly from your workflow diagrams.
By combining visualization with automation, Quixy doesn’t just show you how work flows—it helps you make it flow better, faster, and smarter.
Final Thoughts
Workflow visualizations will now be used generation after generation, enabling employees to structure their projects’ workflows from start to end with a no-code feature. Now, companies can organize data, structure workflow, and automate the implementation of business processes on a single interface.
The workflow diagram helps employees to minimize resource usage while following company standards. The visual workflow hence improves employee engagement, enhances collaboration, and boosts productivity.
Frequently Asked Questions(FAQs)
How do I create a visual workflow?
Identify the Workflow: Determine the process you want to visualize.
Gather Information: Collect details about tasks, roles, and task dependencies.
Choose a Tool: Select a visual tool or software for creating diagrams (e.g., flowchart software, diagramming tools).
Design the Visual Workflow: Use symbols, shapes, and lines to represent tasks, decisions, and the sequence of steps.
Review and Refine: Ensure the visualization accurately represents the workflow and is easy to understand.
What is workflow visualization?
Workflow visualization is the process of representing a workflow or process visually using diagrams, charts, or flowcharts. It provides a clear, graphical representation of the sequence of tasks and steps within a workflow.
What is visual workflow management?.
Visual workflow management involves using graphical representations to design, track, and optimize workflows. It enhances understanding, communication, and decision-making related to processes.
What is a workflow diagram?
A workflow diagram is a graphical representation of a workflow or process that shows the sequence of tasks, decision points, and interactions between tasks. It is often used to illustrate complex processes in a simple, visual format.
What is the purpose of flow visualization?
The purpose of flow visualization is to make complex processes and workflows more understandable and accessible. It helps with process analysis, communication, and process improvement by providing a clear and visual representation of the workflow’s structure and flow.
Related Post


Please login to comment
0 Comments
Oldest
Recent Posts


![]()

![]()
- Download the App