
Are you facing challenges in visualizing and managing your project timelines effectively? Bid farewell to project planning and tracking complexities with Gantt Chart Reports in Quixy. Whether you’re a project manager or a team member, you can now seamlessly create and analyze Gantt charts to enhance project efficiency. In this blog, we’ll explore how Quixy’s Gantt Chart Reports simplify project management, saving you time and ensuring a streamlined workflow.
The Gantt Chart Advantage
Managing projects involves juggling multiple tasks, deadlines, and dependencies. The traditional methods of project management often lead to confusion and inefficiencies. Enter Gantt charts – a visual representation of project timelines that simplifies complex schedules into easy-to-understand, chronological bars.
The Initial Approach
Quixy’s platform introduces Gantt Chart Reports as a dynamic tool to transform your project management experience. Whether initiating a new project or updating an existing one, the Gantt Chart feature provides a visual timeline that clarifies your project’s progress.
Also Read: Beyond Bullets and Charts: Crafting Compelling Document Reports with Quixy
Step-by-Step Guide to Gantt Chart Reports in Quixy
1. Access Gantt Chart Feature
Navigate to the “Reports” section in Quixy and choose the Gantt Chart option. This will be your canvas for visualizing project timelines
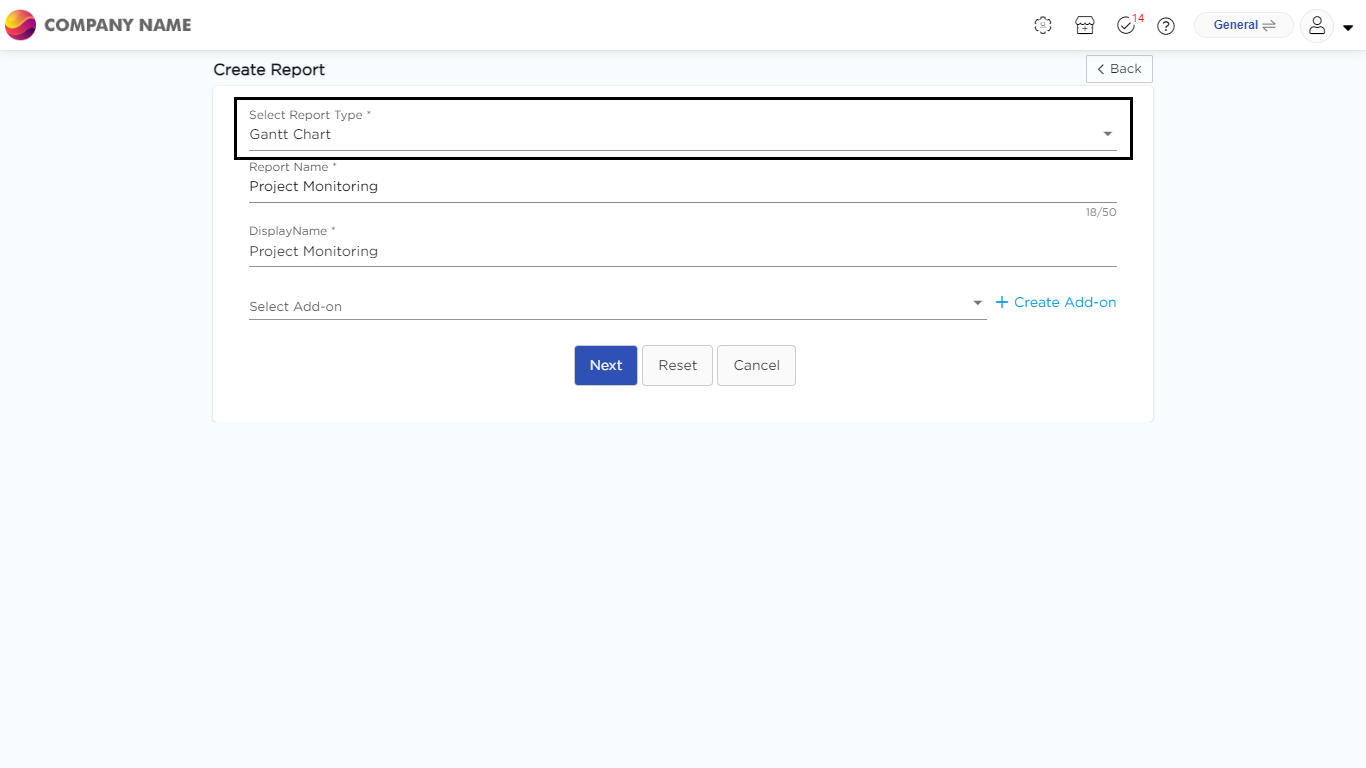
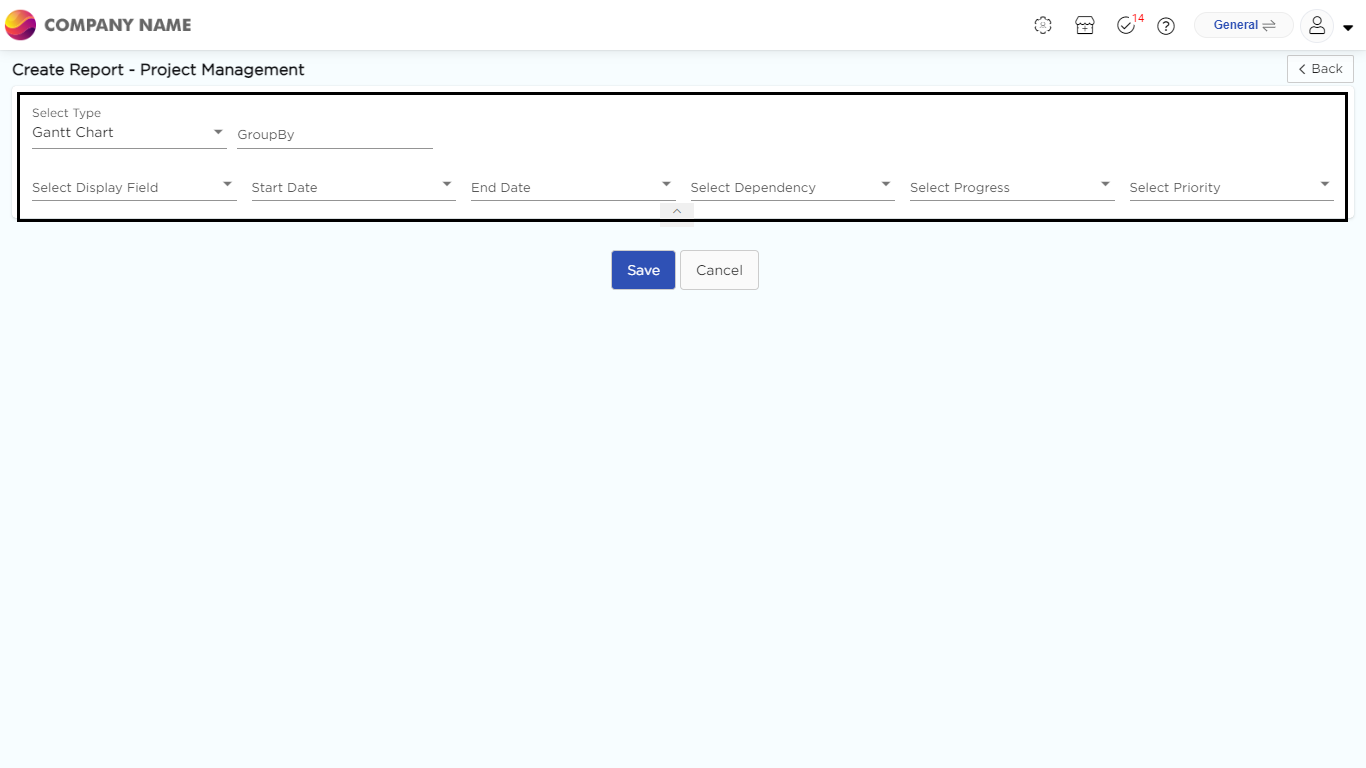
2. Define your Project Settings
Input your project tasks, set start and end dates, and establish task dependencies. The interactive interface allows you to easily choose from the dropdowns to adjust timelines
Also Read: Streamlining Business Rules and Validations in Quixy
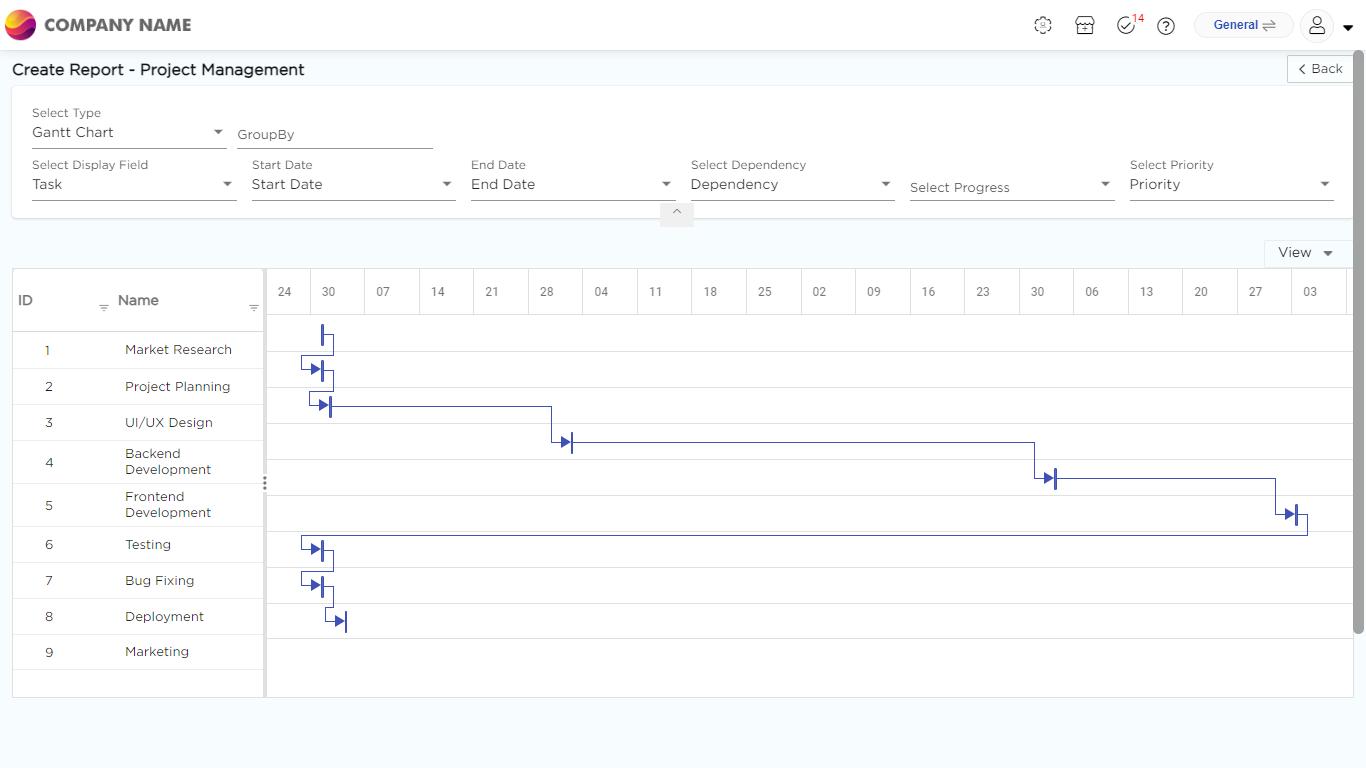
3. Monitor Progress and Collaborate Effectively
Track task completion and project milestones in real-time. The Gantt Chart adapts dynamically as tasks are updated, providing an accurate reflection of your project’s status. Quixy’s Gantt Chart Reports are designed for collaboration. Share your Gantt charts with team members, stakeholders, or clients to ensure everyone is on the same page
Also read: Unlocking Artifact Interconnections: Deep Dive into Quixy’s Solution View
Advantages of Quixy’s Gantt Chart Reports
1. Visual Clarity
Gantt charts offer a visual representation of project timelines, making it easy to comprehend complex schedules and dependencies
2. Efficient Resource Allocation
Optimize resource allocation by identifying overlapping tasks and potential bottlenecks, allowing for proactive adjustments to keep the project on track
3. Real-Time Updates
Stay informed with real-time updates on task progress. Any changes made by team members are instantly reflected in the Gantt Chart, fostering transparency
4. Enhanced Communication
Improve communication within the team and with stakeholders by providing a clear and accessible overview of the project timeline

Also Read: Customer Service Request Management Made Easy with Quixy
Industry-Specific Use Cases
1. Construction Projects
Manage construction projects seamlessly by visualizing tasks such as site preparation, foundation laying, and building construction in a chronological order
2. Event Planning
Streamline event planning by creating Gantt charts for tasks like venue booking, vendor coordination, and promotional activities
3. Product Development
Coordinate product development efforts by mapping out tasks related to design, prototyping, testing, and production phases
Also Read: Quixy’s Sandbox & Thematic Forms: A Paradigm Shift in Development and Deployment!
Conclusion
Quixy’s Gantt Chart Reports empower project managers and teams to take control of project timelines. The user-friendly interface and dynamic features make it easy for both beginners and experienced professionals to leverage the power of Gantt charts. Revolutionize your project management approach today with Quixy’s Gantt Chart Reports.
But why just take our word for it? Experience the efficiency firsthand by signing up for a complimentary trial of Quixy! Explore the platform and witness how Gantt Chart Reports can transform the way you manage projects.
Learn more about creating Gantt Chart Reports with Quixy: https://help.quixy.com/docs/gantt-chart
Frequently Asked Questions(FAQs)
Q. How does the Gantt Chart benefit project management?
A Gantt Chart visually represents project timelines, displaying tasks, deadlines, and dependencies chronologically. It benefits project management by providing a clear overview of the project’s progress, helping to identify potential bottlenecks, allocate resources efficiently, and track task completion.
Q. How does Quixy’s Gantt Chart Reports enhance project management?
Quixy’s Gantt Chart Reports enhance project management by providing a user-friendly interface for creating and visualizing project timelines. With real-time updates, easy collaboration features, and the ability to track task dependencies, Quixy streamlines project planning and execution.
Q. Can Quixy’s Gantt Chart Reports be customized to suit different industries?
Yes, Quixy’s Gantt Chart Reports are highly customizable and can be tailored to suit the specific needs of different industries. Whether you’re managing construction projects, event planning, or product development, Quixy’s Gantt Chart Reports can be adapted to visualize tasks and milestones relevant to your industry.
Q. How can Quixy’s Reports improve communication within project teams?
Quixy’s Gantt Chart Reports improve communication within project teams by providing a clear and accessible overview of the project timeline. Team members can easily track task progress, identify dependencies, and collaborate in real time, ensuring everyone stays informed and aligned towards common goals.
Related Post


Login
Please login to comment
0 Comments
Oldest
Recent Posts


![]()

![]()
- Download the App