
Imagine you’re planning a big event, like the launch of a new product. You have many things to take care of, like sending out invitations, booking a venue, arranging logistics, etc. Even if you have a team to help you, how will you ensure that everyone stays organized and knows what needs to be done and when?
This is where workflow mapping diagrams can help you. These diagrams are like a visual roadmap and, in a step-by-step guide, show you the order of tasks that are to be completed. This diagram helps you see the bigger picture and understand how different tasks are related.
Since these diagrams can be used for various processes, like project management, employee onboarding, or even software development, it’s good to know all about them. So, in this article, let us see what workflow process diagrams are, their types, components, and a lot more.
Workflow Meaning
What is the workflow? The term “workflow” refers to the sequence of tasks or activities that are required to complete a specific process or achieve a particular outcome. It involves the coordination and execution of different steps, often involving multiple individuals or systems, to accomplish a specific goal.
What is a Workflow Diagrams?
A workflow mapping diagram visually represents a process or a series of steps required to complete a task. It’s like a roadmap that shows the sequence of actions, decisions, and interactions between different participants or components in a system. Think of it as a flowchart that illustrates how things are supposed to happen from start to finish.
In a workflow diagram, you’ll typically see various symbols and shapes connected by arrows, each representing a specific action or decision point. These diagrams are incredibly useful in many fields, including project management, software development, business processes, and even everyday activities. They help stakeholders, teams, and individuals understand how a process should be executed, identify potential bottlenecks or inefficiencies, and improve overall productivity and coordination.
Workflow charts diagrams are often confused with flowcharts. Let us see how they are distinct.
Workflow mapping diagrams focus specifically on illustrating the sequence and interactions within a particular workflow. Flowcharts, on the other hand, are more general and can represent various types of processes or information flows beyond just workflows.
Workflow Diagram vs Flowchart
| Aspect | Workflow Diagram | Flowchart |
| Definition | A visual representation of a complete business process, showing tasks, decisions, roles, inputs, and outputs. | A graphical form of a sequence as steps or a process, typically focusing only on the flow of actions or decisions. |
| Purpose | Designed to map, analyze, and improve workflows across teams or systems. | Used to illustrate logical flow, problem-solving steps, or algorithms. |
| Scope | Broader – covers roles, data, handoffs, and interdependencies. | Narrower – emphasizes process flow or logic sequence. |
| Complexity | Can handle complex, cross-functional processes with multiple actors. | Best suited for simple to moderately complex processes. |
| Components | Includes swimlanes, data flows, actors, decisions, and tasks. | Primarily includes start/end points, actions, and decisions. |
| Use Cases | Business process mapping, automation design, compliance documentation. | Algorithm design, troubleshooting workflows, training materials. |
| Best For | Organizations aiming for process optimization and automation. | Explaining simple decision-making processes or step-by-step procedures. |
Also Read: Importance of Workflow Mapping and Easy Steps to Follow
What are the Types of Workflow Diagrams?
Multiple types of workflow mapping diagrams are commonly used to represent different aspects of processes. Some of the notable ones are:
ANSI Diagram
Established by the American National Standards Institute (ANSI), this workflow mapping diagram is a workflow graphic representation that illustrates the sequence of activities, decision points, and interactions within the system workflow diagram or process. This diagram has actually set the standards for workflow mapping diagrams, and its symbols are considered the universal language of workflow symbols.
SSD Flowchart
System Sequence Diagram Flowchart visualizes the sequence of events and actions that occur during the execution of a process, helping understand the flow of information, input, and output. This type of diagram is typically useful for understanding system behavior, analyzing requirements, and communicating system interactions at a higher level.
Swimlane Diagram
Also known as a cross-functional flowchart, a swimlane diagram adds an extra layer of information by assigning activities to specific individuals, departments, or roles. It visually separates the responsibilities of different stakeholders, making it easier to identify who is involved at each step and understand the handoffs between them.
Also Read: How Visual Programming Transforms Software Development?
Data Flow Diagram
This type of diagram focuses on the movement of data within a system or process. It illustrates how data is input, processed, stored, and outputted, showing the interactions between different data sources, processes, and data sinks.
UML Activity Diagram
Unified Modeling Language diagram is used to model complex workflows. It illustrates the order of activities, choices, and how they connect, and is useful for planning and communication. It helps everyone involved to have a common understanding of how things should happen.
Also Read : ER Diagram View: Master Quixy Data Visualization Effortless
Let’s understand the types of Workflow Diagrams with industry examples
Examples of Process Workflow Diagram in Real Industries
Let’s explore workflow diagram examples , how different types of workflow diagrams are applied in real-world scenarios, with examples from manufacturing, healthcare, banking, e-commerce, software development, and more.
ANSI Diagram In Manufacturing,
ANSI diagrams are commonly used to standardize production processes. For example, automotive companies like Ford use ANSI diagrams to map each step of the assembly line, from raw material handling to final vehicle inspection. This ensures that every worker and system follows the same process, reducing errors and maintaining consistency.
SSD Flowchart (System Sequence Diagram) In Healthcare
They are valuable for managing patient information systems. At Mayo Clinic, these healthcare process flow diagrams show the sequence of activities when a patient checks in—recording symptoms, processing diagnostic tests, and generating treatment plans. This helps medical and IT staff clearly understand how patient data flows through different systems.
Swimlane Diagram In banking and finance,
Swimlane diagrams clarify who does what in a process. For instance, Wells Fargo uses swimlanes to show how a loan application moves from the customer to the relationship manager, then to the credit analyst, and finally to the approval committee. Each lane shows responsibilities clearly, making the workflow easy to follow and reducing confusion.
Data Flow Diagram (DFD)
In e-commerce, DFDs map how data moves between systems. For example, Amazon tracks customer orders from placement to payment processing, inventory checks, warehouse handling, and shipping. This ensures smooth coordination across all systems involved in fulfilling an order.
UML Activity Diagram
In software development, UML activity diagrams help teams plan complex workflows. Microsoft, for example, uses UML diagrams to design login processes, showing steps like entering credentials, system validation, and granting access. This ensures that developers, testers, and business teams all share a clear understanding of the process.
A few more examples of workflow diagrams to understand…
Gantt Chart Workflow
In construction, Gantt chart workflows are popular for scheduling projects. Bechtel Corporation uses Gantt charts to map every step of large projects, such as building highways or power plants. This visual timeline helps teams track progress, avoid delays, and coordinate multiple tasks effectively.
SIPOC Diagram (Suppliers, Inputs, Process, Outputs, Customers)
In food and beverage, SIPOC diagrams help control quality and process clarity. Coca-Cola, for instance, maps the bottling process—suppliers (raw materials), inputs (syrup, water, bottles), processes (mixing, filling, packaging), outputs (finished bottles), and customers (distributors and retailers). This ensures smooth production and consistent quality.
Kanban Workflow
In IT and agile software development, Kanban workflows help teams manage tasks visually. Spotify uses Kanban boards to track tasks from “Backlog” to “In Progress” to “Done,” allowing teams to collaborate efficiently and deliver work faster.
What are the Components of a Workflow Diagram?
The components of a workflow mapping diagram can vary depending on the specific diagramming methods or notation being used. Nevertheless, here are some common workflow mapping diagram components that most of the diagrams may have.
- Start and end points: indicate the beginning and conclusion of the workflow.
- Process steps: Represents the individual tasks or actions performed within the workflow. Each step is usually labeled and may include a description.
- Decision points: Specifies where decisions are made within the workflow, often leading to different paths or outcomes based on certain conditions or criteria.
- Connectors and arrows: Shows the direction and sequence of the workflow, linking the various steps and decision points together.
- Inputs and outputs: Denotes the inputs required for each step and the resulting outputs produced as a result of completing a particular task.
- Swimlanes: Helps organize the workflow by grouping related tasks or activities based on the individuals, departments, or roles responsible for them.
Also Read: Top 10 Workflow Automation Software for your Business
What are the Common Symbols and Shapes in a Workflow Diagram?
Workflow mapping diagrams commonly use various symbols and shapes to represent different elements and actions within the process. Here are some of the most common workflow mapping diagrams symbols and shapes you will find in workflow mapping diagrams:
- Rectangle: Represents a process step or activity.
- Diamond: Denotes a decision point where a choice or condition is evaluated, leading to different paths based on the outcome.
- Circle or oval: Indicates the start or end points of the workflow.
- Arrow: Shows the flow and direction of the process, connecting the steps and decision points.
- Connector or line: Links the different elements of the workflow, illustrating the sequence and order of tasks.
- Parallel lines: Oten, used horizontally, represents a subprocess or sub-flow that can be executed concurrently with other steps.
- Document: Represents a document or information input or output.
- Terminator: A rounded rectangle or capsule shape usually indicates a termination point or an external entity interacting with the workflow.
- Data storage: A rectangle with vertical lines at the left and right edges represents data storage, such as a database or file.
- Annotation: Often represented as rectangles with folded edges or sticky note shapes, it provides additional information or explanations about a specific step or decision.
Also Read: Visual Workflow Builder: Simplifying Process Automation
By combining these symbols and shapes, you can visually represent any workflow or process, including the steps, decision points, inputs, outputs, and the overall flow from start to finish. The connectors and arrows ensure that the workflow is presented in a logical & sequential manner, making it easier for the reader to understand and analyze.
Also Read: Workflow Automation and Workflow Management
What are the Steps to Create a Software Workflow Diagram? (From Analysis to Workflow Design)
Your step to begin creating a workflow diagram should be to thoroughly understand why you need this diagram and what purpose it is going to solve for you. Once you have the answer, here are steps that you can follow:
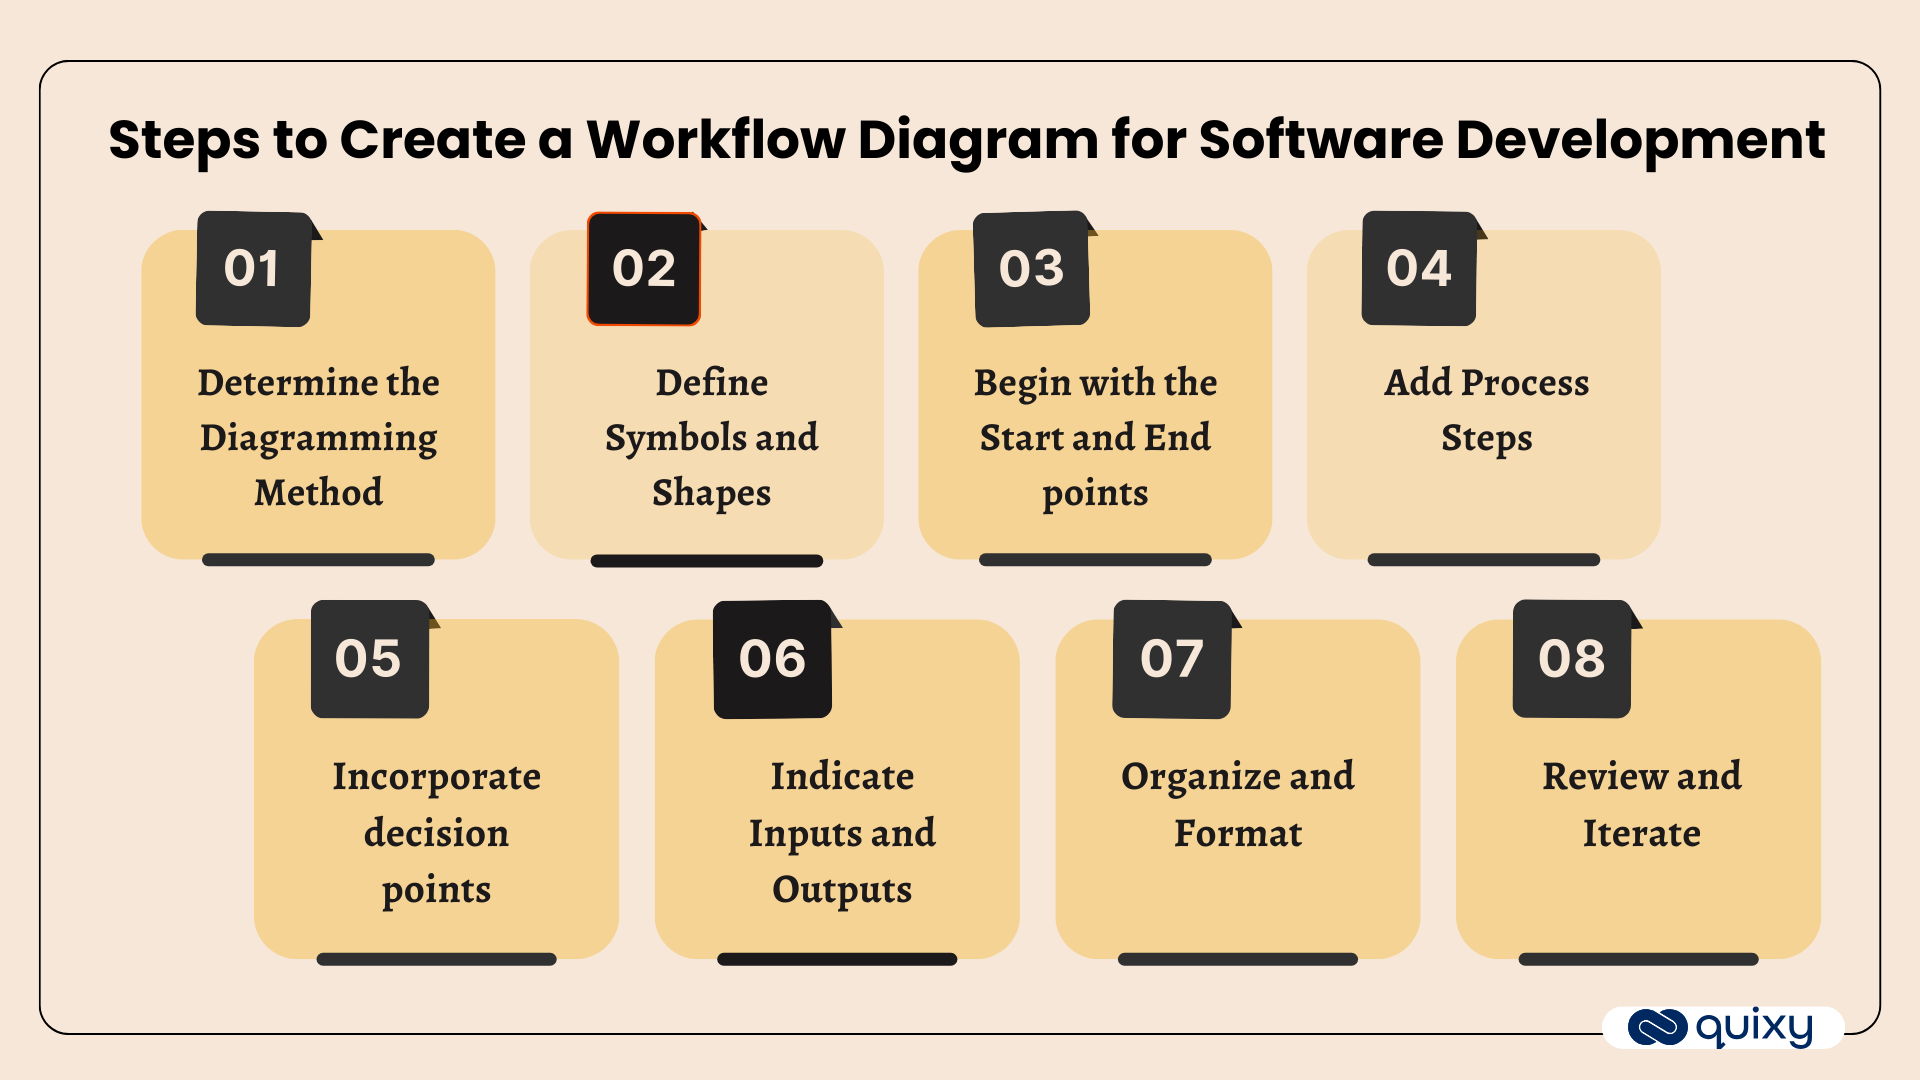
1. Determine the Diagramming Method
Choose a diagramming method or notation that suits your needs. We have discussed some common types of workflow diagrams above, and one of them may fit your needs.
2. Define Symbols and Shapes
We have already seen above that when it comes to shapes; you have everything from rectangles and ovals to arrows and connectors to choose from. Familiarize yourself with these symbols and shapes and see how they represent different elements of your workflow.
3. Begin with the Start and End points
When you finally begin designing, place the workflow’s start and end points in your diagram. Use circle or oval shapes to represent the beginning and conclusion of the process.
4. Add process steps
Identify the individual steps or activities within the workflow and represent them using rectangles or other appropriate shapes. Arrange them in sequential order to depict the flow.
5. Incorporate decision points
Identify decision points within the workflow where choices or conditions affect the flow. Use diamond shapes to represent these decision points and connect them with appropriate arrows to show different paths based on outcomes.
6. Indicate Inputs and Outputs
Add symbols or shapes to represent the inputs and outputs associated with each step or activity. This could include documents, data storage symbols, or any other relevant representations.
7. Organize and Format
Arrange the diagram in a logical and easy-to-follow manner. Use swimlanes or other organizational techniques to group related activities or responsibilities. Apply formatting, such as colors or shading, to enhance readability.
8. Review and Iterate
Review your workflow diagram for accuracy, clarity, and completeness. Make any necessary revisions or iterations to improve the diagram’s effectiveness in conveying the workflow.
What are the 5 Common Workflow Improvement Theories?
Workflow improvement involves analyzing workflows to optimize resource utilization, minimize errors, and improve overall performance, all with the aim of enhancing the efficiency of work processes within an organization.
Workflow improvement vs. Business process management
Both terms are often used interchangeably when, in reality, they are related but different concepts.
Workflow improvement targets the optimization of individual workflows to enhance efficiency and productivity. On the other hand, business process management (BPM) takes a broader perspective, managing and improving end-to-end business processes across the organization, including multiple workflows, coordination, and alignment with organizational goals and technology integration.
Now that the meaning of workflow improvement and how it is different from business process management is clear let us look at the five common workflow improvement theories:
1. Lean Six Sigma
This methodology combines the principles of Lean Manufacturing (reducing waste) and Six Sigma (improving quality and reducing defects) to systematically identify and eliminate inefficiencies in workflows.
2. Business Process Reengineering (BPR)
BPR centers its attention on the thorough overhaul of fundamental business processes, aiming to attain remarkable enhancements in performance, efficiency, and customer satisfaction.
3. Kaizen
Rooted in the Japanese philosophy of continuous improvement, Kaizen emphasizes making incremental changes to workflows on an ongoing basis, involving all employees in the process to foster a culture of continuous improvement.
4. Theory of Constraints (TOC)
TOC aims to identify and address the bottlenecks or constraints that limit overall system performance, ensuring that workflows are optimized to maximize throughput and minimize delays.
5. Agile Methodology
Initially developed for software development, Agile has gained broader applicability and emphasizes iterative, adaptive approaches to managing workflows, focusing on collaboration, flexibility, and responsiveness to change.
The Dynamic Duo of Workflow Diagrams and Automation
Workflow diagram and workflow automation play crucial roles in streamlining processes and enhancing efficiency within organizations. A workflow diagram visually represents the sequence of tasks, decisions, and interactions involved in a specific workflow. It provides a clear overview of the entire process, allowing stakeholders to identify bottlenecks, optimize steps, and improve overall productivity. On the other hand, workflow automation automates repetitive tasks, reducing manual efforts and human errors.
Organizations can automate workflows, trigger actions based on predefined conditions, and facilitate seamless collaboration across teams by integrating technology and software solutions. Workflow automation eliminates time-consuming manual interventions, enhances communication, accelerates task completion, and ensures consistency in process execution. The combination of workflow diagram and automation empowers organizations to achieve operational excellence, streamline processes, and achieve higher levels of productivity.
Also Read: Effective ROI with No-Code Business Workflow Automation
Harness Workflow Diagram With AI Powered LCNC
Workflow diagram, automation, and no-code development are interconnected concepts that can greatly enhance business processes. Workflow diagram visually represent the sequence of tasks and activities in a process, making it easier to understand and analyze. Automation refers to the use of technology to automate manual or repetitive tasks, improving efficiency and reducing errors. No-code development allows non-technical users to create software workflow design and automation workflows without writing code.

By combining workflow diagram with automation and no-code development, organizations can streamline their operations. Workflow diagram serve as a blueprint for designing automated processes and identifying areas where automation can be applied effectively. No-code development platforms provide intuitive tools and pre-built components that enable users to create automation workflows without coding knowledge. This empowers business users to automate tasks, integrate systems, and optimize processes, reducing reliance on IT resources.
The combination of workflow diagram, automation, and no-code development empowers organizations to improve productivity, eliminate manual errors, and adapt to changing business needs more quickly. It enables businesses to leverage technology effectively, automate routine tasks, and focus on higher-value activities that drive growth and innovation.
Conclusion
Workflow diagrams are powerful tools for understanding and optimizing workflows. They simple workflow diagram that represent the sequence and interactions of activities, helping identify bottlenecks and areas for improvement. Workflow diagrams drive productivity, streamline operations, and improve outcomes. By embracing these diagrams, you can gain a holistic understanding, make informed decisions, and achieve greater success in your business operations.
With Quixy’s AI-powered, effortless platform, you can build rapid, robust applications, automate workflows, and supercharge efficiency. Get started today—schedule a demo with our expert team and see how Quixy can transform your workflow instantly!
Frequently Asked Questions (FAQs)
Q. Why develop workflow diagram?
Workflow diagrams help visualize processes in a clear, step-by-step format. They allow teams to identify bottlenecks, reduce errors, and improve efficiency. By mapping tasks, responsibilities, and decision points, businesses can standardize operations and ensure everyone follows the same workflow. For organizations using low-code/no-code platforms like Quixy, workflow diagrams become the blueprint for building automated applications faster and with fewer errors.
Q. Why do companies perform a workflow analysis?
Companies perform workflow analysis to understand how tasks move across teams and systems. This helps uncover inefficiencies, redundancies, or delays that slow down operations.
Workflow analysis also reveals automation opportunities, enabling businesses to streamline repetitive tasks. With LCNC platforms, these insights can directly translate into creating automated workflows without coding, saving time and reducing dependency on IT.
Q. What are workflow diagrams?
Workflow diagrams are visual representations of a process, showing how tasks, decisions, and data flow from start to finish. They use symbols like rectangles for steps, diamonds for decisions, and arrows for direction.
These diagrams make complex processes easier to understand, optimize, and automate. In a low-code/no-code environment, they serve as the design blueprint to quickly build applications or automated workflows.
Q. What is the best way to create a workflow diagram?
Start by mapping out the key steps, decision points, and roles involved in the process. Use standard symbols to ensure clarity and consistency. Tools like Quixy allow you to drag and drop elements, define automation rules, and simulate workflows in real-time. Always review with stakeholders to ensure accuracy, then iterate based on feedback. Keep it simple, actionable, and aligned with the business outcome.
Q. What is a workflow chart?
A workflow chart is another way to visualize a process from start to finish. It focuses on the sequence of tasks, responsibilities, and decision points, often using flowchart symbols. While similar to workflow diagrams, charts are often simpler and easier for quick understanding. On LCNC platforms, these charts can directly guide application logic, enabling seamless automation and integration across teams.
Q. What are some workflow diagram examples?
Examples include:
Approval workflows (e.g., leave or purchase requests)
Order processing (e-commerce or manufacturing)
Onboarding workflows (HR systems)
IT incident management
Financial reporting
Inventory management
Each diagram visualizes steps, decisions, and handoffs. Using a platform like Quixy, these examples can be automated without coding, making processes faster and more reliable.
Q. How does the approval workflow diagram work?
An approval workflow diagram shows the path a request follows before final approval. For example, an employee submits a leave request (start), the manager reviews it (decision), and HR updates records (end). Diamonds represent decisions, rectangles are tasks, and arrows indicate the flow.
On a low-code/no-code platform, this diagram becomes an automated workflow where notifications, approvals, and record updates happen automatically, reducing delays and errors.
Related Post


Please login to comment
0 Comments
Oldest
Recent Posts


![]()

![]()
- Download the App