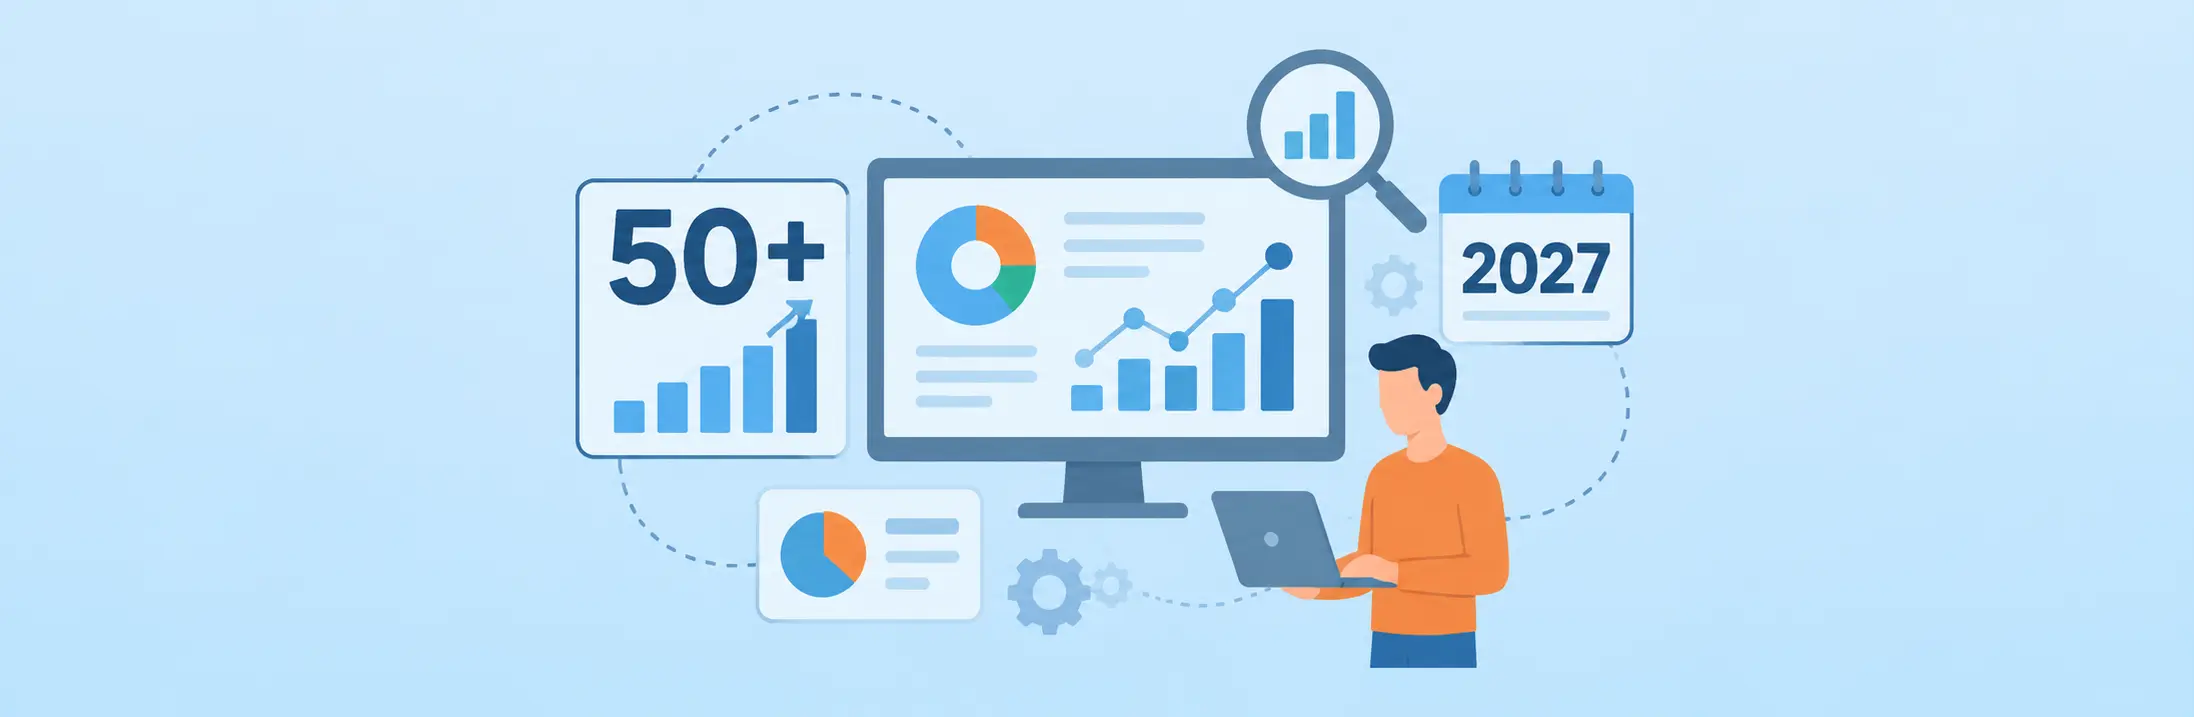

Data visualization statistics reveal how organizations are changing the way they collect, interpret, and use business information. As enterprises generate more data across applications, departments, and workflows, dashboards, interactive reports, and AI-powered analytics are becoming increasingly important for turning complex information into actionable insights.
In 2027, the focus is shifting beyond simply presenting data through charts and graphs. Businesses increasingly need to understand what is happening across their operations, why performance is changing, and which actions can improve results. This is driving interest in real-time dashboards, predictive analytics, automated reporting, and visual business intelligence.
The growing adoption of artificial intelligence is also changing how organizations interact with data. According to McKinsey’s 2025 State of AI survey, 88% of respondents reported regular AI use in at least one business function, compared with 78% in the previous year. This growing adoption creates new opportunities for organizations to use AI-assisted analysis and make information more accessible to decision-makers.
For business leaders, IT professionals, and operations teams, these developments raise important questions: How widely are organizations adopting visual analytics? Which technologies are influencing the industry? What role will AI play in business reporting? And how can companies use dashboards to improve operational visibility?

This article explores 50+ statistics, research findings, and industry insights to explain the changing data visualization landscape, its business applications, and the trends organizations should watch in 2027. Since 2027 is still ahead, the forward-looking insights below are projections and emerging trends, not measured 2027 outcomes.
1. Data Visualization Adoption Statistics: How Businesses Use Visual Analytics
Organizations increasingly rely on visual reporting to make large datasets easier to interpret. Instead of reviewing multiple spreadsheets or disconnected reports, decision-makers can use charts, dashboards, and performance indicators to understand business conditions.
The following research findings highlight the broader technology adoption environment influencing visual analytics.
- 88% of respondents in McKinsey’s 2025 survey said their organizations regularly used AI in at least one business function.
- 78% reported organizational AI use in the previous year’s survey.
- 62% of respondents said their organizations were experimenting with or scaling AI agents.
- 23% reported scaling an agentic AI system somewhere in their enterprise.
- 39% reported experimenting with AI agents.
- 64% said AI was enabling innovation in their organizations.
- 80% said efficiency was an objective of their AI initiatives.
- Approximately one-third reported that their organizations had begun scaling AI programs across the enterprise.
These findings matter because visual analytics increasingly operates alongside enterprise AI systems. As organizations introduce more AI applications, they also need accessible ways to monitor results, interpret performance, and communicate findings.
For example, a business operations team may use a dashboard to monitor service requests, approval delays, workload distribution, and departmental performance. Rather than manually compiling reports, teams can examine consolidated information and identify where attention is required.
2. Business Intelligence and Analytics Statistics
Business intelligence (BI) helps organizations convert operational and historical data into information that supports business decisions. Visualization is an important part of this process because it makes analytical findings easier to communicate.
- Gartner identifies the convergence of data and analytics platforms as a major strategic direction for enterprise technology.
- Gartner identifies semantic layers as an important foundation for improving consistency in enterprise analytics.
- Agentic analytics is emerging as a significant development in the business intelligence landscape.
- Gartner expects more than one in 10 enterprises to be AI-first by 2030.
- Gartner predicts that 40% of enterprises will have leveraged GraphRAG techniques by 2029.
- Gartner predicts that adoption of data streaming for agentic AI will exceed 60% by 2028, compared with less than 15% in 2025.
These developments indicate that enterprise analytics is moving toward connected platforms, contextual data, and faster decision-making. Businesses are not simply looking for more reports; they need information that can be understood and acted upon.
For organizations evaluating analytics capabilities, the important considerations include data integration, visualization flexibility, reporting accuracy, accessibility, and governance.
3. Dashboard Statistics: The Growing Importance of Business Reporting
Dashboards provide a consolidated view of important business metrics. They help managers monitor performance without manually reviewing information from multiple sources.
However, dashboard effectiveness depends on more than the number of charts displayed. Relevant metrics, accurate data, clear visual hierarchy, and timely updates determine whether a dashboard supports better decisions.
- Executive dashboards commonly prioritize organizational performance and strategic KPIs.
- Operational dashboards focus on ongoing activities and process performance.
- Analytical dashboards help users investigate historical patterns and relationships.
- Interactive dashboards allow users to filter and explore information.
- Role-based dashboards present information according to individual responsibilities.
- Automated reporting reduces dependence on manually prepared reports.
- KPI dashboards help organizations compare actual performance against defined targets.
- Real-time reporting supports faster identification of operational changes.
These are dashboard capability and application insights, rather than claimed percentages from a single industry survey.
For instance, a finance manager may need visibility into budgets and expenditure, while an operations manager may prioritize pending approvals, turnaround times, and resource utilization. A single dashboard design cannot serve every role equally well.
This is why task management dashboards and departmental reporting views should be designed around specific business decisions rather than displaying every available metric.
4. AI-Powered Data Visualization Trends in 2027
Artificial intelligence is changing how users interact with business information. Instead of relying entirely on predefined reports, employees can increasingly ask questions in natural language, identify patterns, and receive analytical recommendations.
- Natural language interfaces are making analytics more accessible to non-technical users.
- AI-assisted chart recommendations can simplify visualization selection.
- Automated anomaly detection helps identify unusual changes in business metrics.
- Predictive analytics can help organizations estimate future performance.
- Conversational analytics allows users to explore information through questions.
- Automated insights can highlight important changes in datasets.
- AI-assisted data preparation can reduce repetitive analytical work.
- Context-aware analytics can connect business questions with relevant enterprise information.
These developments also introduce new responsibilities. AI-generated findings must be validated against reliable source data, and organizations need clear access controls and governance policies.
A useful example is an operations manager asking why approval turnaround time increased during a particular month. An AI-assisted analytics system could help identify changes across departments, approval stages, and workloads. The manager can then investigate the underlying cause instead of relying on a single performance figure.
5. Operational Analytics: How Businesses Use Data to Improve Performance
Operational analytics connects business information with everyday activities. It helps organizations understand how processes perform, where delays occur, and whether resources are being used effectively.
Unlike high-level financial reporting, operational analysis often focuses on activities that change throughout the working day.
- Process completion rates help measure how efficiently work moves through different stages.
- Average turnaround time reveals how long processes take to complete.
- Pending workload helps identify capacity constraints.
- SLA compliance measures whether teams meet agreed service timelines.
- Approval cycle analysis highlights delays in decision-making.
- Resource utilization metrics help managers understand workload distribution.
- Exception reporting identifies activities that require additional attention.
- Historical performance comparisons help reveal recurring operational patterns.
These measures become more valuable when organizations connect them with workflow analysis and process performance data.
For example, a procurement team could monitor purchase requests from submission through approval and final processing. If requests consistently remain pending at one approval stage, the organization can investigate staffing, authorization rules, or process dependencies.
Similarly, business process analytics helps organizations understand performance across multiple departments rather than treating every activity as an isolated task.
Read More: Business Process Optimization: Definition, Benefits & Proven Techniques
A useful way to approach this is to connect process data with measurable outcomes. Instead of reporting only how many requests were completed, organizations can also measure how long completion took, how many requests required rework, and where exceptions occurred.
6. Real-Time Reporting and Data Integration Trends
Business information loses value when it reaches decision-makers too late. This is one reason organizations are increasingly interested in connected data environments and timely reporting.
- Real-time data streaming supports continuous information delivery.
- API-based integration helps connect information across business applications.
- Cloud-based analytics supports access to business information across locations.
- Automated data synchronization reduces manual information transfers.
- Centralized reporting can reduce inconsistencies between departmental reports.
- Event-driven analytics can trigger alerts when important business conditions change.
The growing importance of streaming data is also reflected in Gartner’s 2026 predictions. Its forecast that data streaming adoption for agentic AI could exceed 60% by 2028 highlights the importance of timely information for automated decision-making.
For organizations, this means reporting infrastructure should support more than scheduled spreadsheets. It should connect relevant systems, maintain consistent data definitions, and provide information at the speed required by the business.
A manufacturing company, for instance, may need production updates throughout a shift, while a financial services team may prioritize transaction exceptions and approval status. Their reporting requirements differ, but both depend on reliable and timely information.
7. Data Visualization Statistics by Business Application
The value of visual analytics becomes clearer when examined through practical business applications.
- Sales performance monitoring: Teams use visual reports to compare revenue, pipeline movement, and target achievement.
- Financial reporting: Finance departments use charts to examine expenditure, budgets, and financial performance.
- Human resource analytics: HR teams analyze recruitment progress, employee distribution, and workforce trends.
- Customer analytics: Businesses examine customer behavior, retention patterns, and service performance.
- Supply chain reporting: Teams monitor inventory levels, order status, and delivery performance.
- Project reporting: Project managers track milestones, resource allocation, and completion progress.
- IT service reporting: IT teams monitor ticket volumes, resolution times, and service-level performance.
- Compliance reporting: Organizations monitor audit findings, outstanding actions, and regulatory requirements.
These examples demonstrate why visual analytics is relevant across industries. The information being analyzed changes, but the objective remains consistent: make business performance easier to understand and act upon.
For example, a project manager may use KPI tracking to identify projects falling behind schedule, while an HR manager may compare recruitment performance across departments. Both require relevant information presented in a format that supports their decisions.
8. Data Visualization Software: What Should Businesses Compare?
As organizations evaluate analytics and reporting solutions, selecting software requires looking beyond the number of charts or templates available.
The right solution should support business requirements, connect with existing systems, and make information accessible to the people who need it.
The following comparison highlights important evaluation criteria.
| Evaluation criteria | Basic reporting tools | Enterprise analytics platforms |
| Data sources | Limited or manually imported | Multiple connected sources |
| Reporting | Predefined reports | Customizable reports |
| Visualization | Standard charts | Interactive visualizations |
| Data updates | Often scheduled | Scheduled or real-time, depending on integration |
| Analytics | Descriptive reporting | Descriptive, diagnostic, and predictive capabilities |
| User access | Limited sharing options | Role-based access controls |
| Automation | Manual reporting processes | Automated reporting and alerts |
| Scalability | Suitable for smaller requirements | Designed for broader enterprise requirements |
| Decision support | Basic performance visibility | Advanced analysis and exploration |
The comparison is a general evaluation framework, not a claim that every product in either category has identical capabilities.
When comparing solutions, businesses should consider whether the software can support their reporting requirements without creating additional data silos or administrative complexity.
For organizations that also need process-level reporting, business process reporting should be evaluated alongside traditional BI capabilities. This helps ensure that teams can understand not only what the numbers show but also which activities contribute to those results.
Read More: Top 10 Business Process Management Tools & Software 2026
9. Key Data Visualization Challenges Businesses Should Prepare for in 2027
Adopting more visualization tools does not automatically improve business intelligence. Organizations must address the underlying challenges that affect data quality, usability, and decision-making.
1. Inconsistent data across systems
Information stored across disconnected applications can produce conflicting reports. Organizations need standardized definitions and reliable integration processes.
2. Too many dashboard metrics
Displaying excessive information can make it difficult to identify important performance indicators. Dashboards should prioritize metrics according to business objectives.
3. Poor data quality
Incomplete, outdated, or inaccurate records can lead to misleading conclusions. Data validation should be part of the reporting process.
4. Limited user adoption
Even advanced analytics tools provide limited value when employees cannot understand or use them effectively. Training and accessible interfaces are important.
5. Data security and governance
Organizations must establish appropriate permissions, access controls, and data-handling policies, especially when reporting involves sensitive information.
6. Difficulty translating insights into action
Identifying a problem is only the first step. Businesses also need clear ownership, accountability, and processes for responding to the findings.
These challenges show why successful analytics requires a combination of technology, governance, and business understanding.
10. What Data Visualization Trends Will Shape 2027?
Based on developments identified in Gartner’s 2026 research and McKinsey’s AI adoption findings, several trends are likely to influence enterprise analytics in 2027.
- Conversational analytics: Users will increasingly explore business information through natural language questions.
- Predictive reporting: Organizations will place greater emphasis on forecasting potential business outcomes.
- Embedded analytics: Visual reporting will increasingly appear within the business applications employees already use.
- Automated anomaly detection: Systems will help identify unusual patterns without requiring continuous manual monitoring.
- Unified data platforms: Organizations will seek more consistent reporting across connected systems.
- Decision intelligence: Analytics will increasingly connect information with recommendations and business actions.
- AI governance: Transparency, validation, and accountability will become important considerations for AI-assisted reporting.
- Personalized dashboards: Role-specific information will help employees focus on the metrics relevant to their responsibilities.
The important shift is from reporting what happened to helping organizations understand what is happening, what may happen next, and what action should follow.
Read More: Process Automation Technology: What It Is and How It Actually Works
Conclusion
The data visualization statistics and industry developments discussed in this article point to a broader shift in how organizations approach business intelligence. Visual reporting is moving beyond static charts and periodic reports toward connected analytics, AI-assisted insights, and more responsive decision-making.
In 2027, organizations will increasingly need reporting systems that combine reliable data, interactive dashboards, automated updates, and meaningful performance indicators. However, adopting new technology alone will not guarantee better outcomes. Data quality, governance, user accessibility, and the ability to translate insights into action will remain equally important.
For businesses, the opportunity lies in connecting analytical information with everyday operations. Understanding performance across processes, departments, and teams can help decision-makers identify inefficiencies and make more informed choices.
As organizations modernize their reporting environments, platforms such as Quixy and other enterprise solutions are part of a wider ecosystem supporting workflow visibility, operational reporting, and business process improvement.
The organizations that get the most value from visualization will be those that move beyond collecting data and focus on using it to make better business decisions.
Frequently Asked Questions
1. What are the most important data visualization trends for 2027?
The most important trends include AI-powered analytics, conversational reporting, predictive visualization, real-time dashboards, embedded analytics, automated anomaly detection, and personalized reporting. These developments are making business information more accessible and useful for decision-makers.
2. How does data visualization improve business decision-making?
Data visualization presents complex information through charts, graphs, and dashboards, making patterns and performance changes easier to identify. It helps managers compare KPIs, monitor business activities, identify operational issues, and make decisions using relevant information rather than assumptions.
3. What are the most important metrics to track using business dashboards?
Important dashboard metrics depend on business objectives and departmental requirements. Common examples include:
- Revenue growth and profitability
- Customer acquisition and retention
- Task completion rates
- Process turnaround time
- Employee productivity
- SLA compliance
- Operational costs
- Project completion rates
4. How is AI changing data visualization?
AI is making data visualization more interactive through natural language queries, automated insights, predictive analysis, and anomaly detection. Users can explore information more easily, identify unusual patterns, and understand potential business outcomes without depending entirely on manual analysis.
5. What should businesses consider when choosing data visualization software?
Businesses should evaluate data integration capabilities, dashboard customization, reporting flexibility, real-time updates, scalability, security, access controls, and ease of use. They should also consider whether the software supports their existing business applications and reporting requirements.


Recent Posts







- Download the App