
Do you know that ER Diagram and Information Modeling have a long history? However, this ever-growing data management landscape was popularized in 1976.
Understanding data table relationships is key to efficient database administration and insight generation. Quixy’s ER Diagram View takes this further by providing a clear and visual representation of the data tables, allowing users to quickly grasp the structure, connections, and key relationships between tables. This feature streamlines database management, offering users a more intuitive way to navigate and understand complex data.
What is Entity-relationship Diagram View?
Traditionally, data tables are presented in a list format, which can be efficient but somewhat limited when trying to understand how data tables relate. The ER Diagram View visually represents data tables within a workspace, visually displaying columns, primary keys, and foreign key relationships. This view eliminates the need to navigate each table individually, providing users with a comprehensive snapshot of how data tables interact and are connected.
Also Read: Mastering Workflow Diagrams: Definitions, Types, Symbols, and Theories
How to Access the ER Diagram View in Quixy
Navigating to the ER Diagram View is simple. From the Admin Menu, follow these steps:
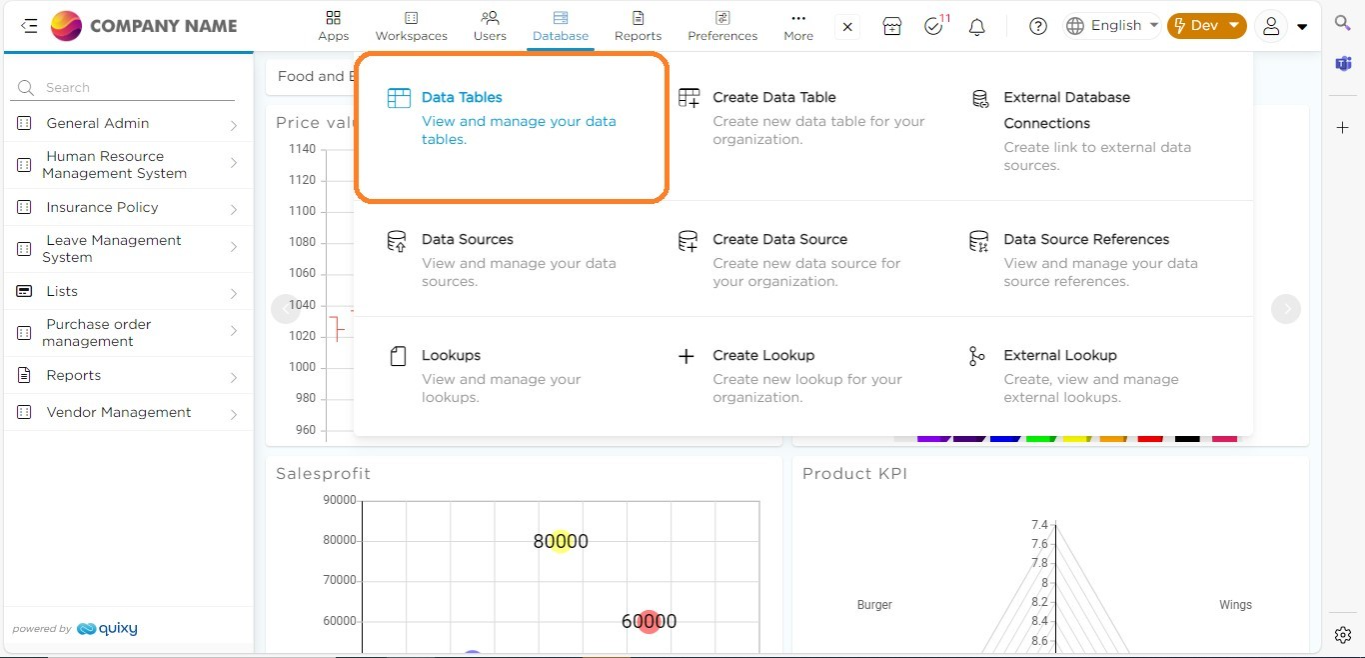
1. Select
From the Admin menu, select the database option and click on data tables.
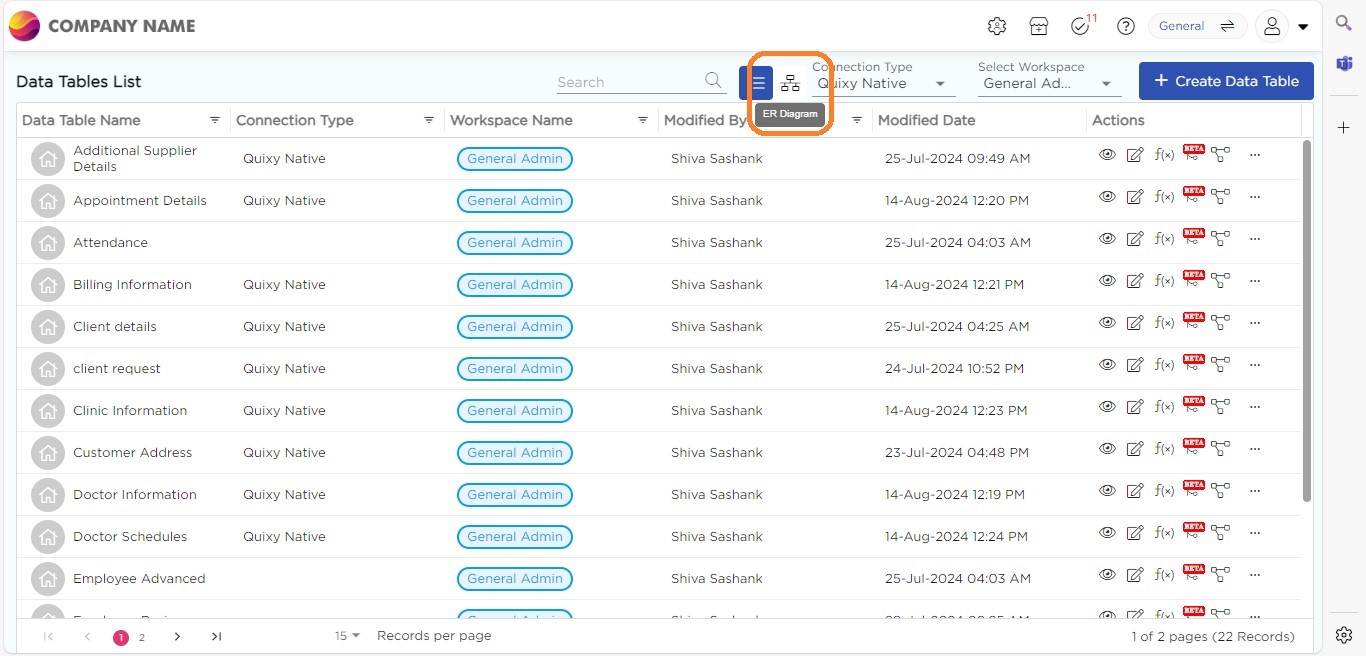
2. Change view type
From the Data Tables List Page, filter a specific workspace. At the top of the page, you’ll see two options: List View and ER View.
3. ER view is ready
By selecting ER View, Citizen Developers instantly see the entity-relationship diagram of all the data tables within the workspace.
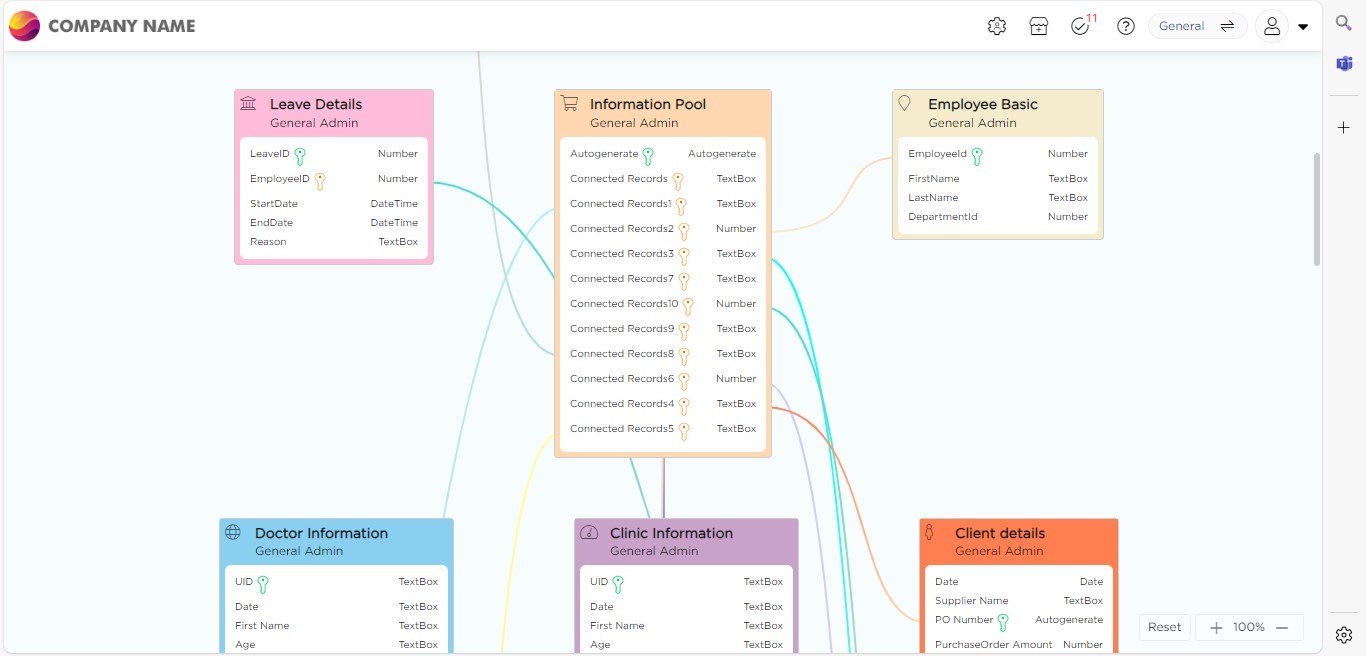
This ER Diagram displays all tables, their respective columns, and their relationships through primary and foreign keys, giving administrators a comprehensive overview at a glance.
Simplified Data Management
Data Admins, Organization Admins, and Citizen Developers can perform general actions directly from the ER Diagram View. Whether you need to view, manage, or edit data tables, you can do so efficiently using the burger menu (three horizontal lines) associated with each table. This functionality simplifies the management process and allows quick adjustments without switching back to the traditional list format.
Also Read: Quixy Release 4.4 (August 2024) Platform Updates
Benefits of the ER Diagram View
Clear Understanding of Data Relationships
The ER Diagram View provides a holistic view of how data tables are related, offering more transparency into the database structure. This is especially helpful for those working with multiple tables, as it reduces the need for manual navigation through each one.
Visual Representation of Key Relationships
Including primary and foreign keys in the diagram allows admins to see the connections between tables instantly, which is essential for designing, troubleshooting, or optimizing data systems.

Improved Collaboration
A visual representation of the data structure helps teams improve collaboration more effectively. Whether it’s developers, data admins, or other stakeholders, the ER Diagram View gives everyone a clearer understanding of the database without requiring deep technical knowledge.
Also Read: Guide to Utilizing Low-Code and Change Management
Industry Use Cases of ER Diagram View
Software Development
In software development, databases often grow complex with multiple tables and relationships. The ER Diagram View allows developers and database administrators to easily visualize these relationships, helping design and refine efficient database architectures. It also ensures that all dependencies and connections between modules are accounted for
Healthcare
Healthcare systems manage large volumes of data, including patient records, medical histories, and treatment plans. The ER Diagram View provides healthcare administrators with a visual understanding of how these datasets are connected, enabling better data governance and smoother integrations across multiple departments.
E-Commerce
E-commerce platforms rely heavily on interconnected datasets such as product catalogs, customer profiles, orders, and inventory management. The ER Diagram View helps e-commerce businesses visualize how these tables relate, improving the efficiency of database maintenance, and ensuring that key relationships (e.g., customer orders to products) are correctly established and optimized.
Finance
Banks and financial institutions handle a wide range of data across accounts, transactions, clients, and loans. Using the ER Diagram View, data administrators can easily track relationships between these tables, ensuring that compliance requirements are met, while optimizing the system for performance. This helps reduce errors and maintains a secure, well-organized financial database.
Education
Educational institutions manage diverse data sets including student records, faculty information, courses, and enrolment details. The ER Diagram View makes it easier for administrators to visualize complex data connections, helping them maintain the integrity of student information and optimize course management systems.
Also Read: Visual Workflow Builder: Simplifying Process Automation
Conclusion
Quixy’s ER Diagram View enhances the way it’s admins manage and interact with their data tables. Providing a visual and interactive representation of tables and their relationships helps teams work more efficiently, reduces the complexity of navigating through tables, and offers a more streamlined approach to data management. Whether you’re an admin managing multiple tables or a citizen developer looking for a quick overview, the ER Diagram View is a powerful tool that brings clarity and simplicity to your data landscape.
Explore the power of visual data management with Quixy’s ER Diagram View and discover how it can revolutionize your database workflows.
Learn more about creating data tables using Excel in Quixy.
Frequently Asked Questions ( FAQ’s)
Q. How does the ER View differ from the traditional list view?
Unlike the traditional list view, which displays data tables individually, the ER Diagram View shows all data tables and their relationships in a single graphical interface. This allows users to visualize how the tables relate to each other without having to navigate through each table manually.
Q. How does the ER diagram View improve database collaboration?
The visual nature of the ER View makes it easier for teams to collaborate, as it provides a clear understanding of the database structure. Both technical and non-technical users can quickly grasp key relationships, making it a valuable tool for improving communication and decision-making across teams.
Q. What are some industry use cases for the ER Diagram View?
Industries such as software development, healthcare, e-commerce, finance, and education can all benefit from the ER Diagram View. It helps visualize complex data relationships, improve database architecture design, ensure compliance, and optimize database maintenance and performance.
Q. How can I access the ER Diagram View in Quixy?
To access the ER Diagram View in Quixy, navigate to the Data Tables List Page under the database option in the Admin Menu. From there, filter a specific workspace and select the ‘ER View’ option at the top of the page to view the entity-relationship diagram of all data tables in that workspace.
Related Post


Login
Please login to comment
0 Comments
Oldest
Recent Posts


![]()

![]()
- Download the App